

The modern intelligence ecosystem is saturated with satellite imagery, signals intelligence, and cyber telemetry. Yet in certain Washington crisis moments, one of the most visible external traces can be something far more mundane: institutions sliding into late-night “fast food” mode.
The “Pentagon Pizza Index” reads unusual spikes in activity at pizza spots around the Pentagon as a low-cost open-source intelligence (OSINT) signal about the operational tempo of the defense bureaucracy.
Note: This index is not an official intelligence product. Dashboards and social-media monitoring posts should be treated not as “proof” but as a trigger to watch more closely.
What the index is, and what it measures
The “Pentagon Pizza Index” (PPI: Pentagon Pizza Index) is an informal OSINT correlation. It tracks sudden increases in “activity” signals around Pentagon-area pizza businesses (especially public indicators such as Google Maps “Popular Times”) and interprets them as a hint that the Pentagon may be operating at an unusually high work tempo.
The underlying claim is simple: in a crisis, shifts run long, leaving becomes harder, and food delivery can become the quickest and most logistically convenient option.
The critical framing is this: the index does not tell you “what will happen.” At best, it produces an operational rhythm signal along the lines of “something unusually busy may be happening inside right now.”
Method note: In most examples in this piece, what is being observed is not the number of orders, but venue-busyness signals (map telemetry) and the interpretation of those signals as an “anomaly.”
Below, I unpack the Pentagon Pizza Index narrative (pizzint.watch) through a few visuals and sourced examples.
1970s-1980s: The Soviet “PIZZINT” doctrine
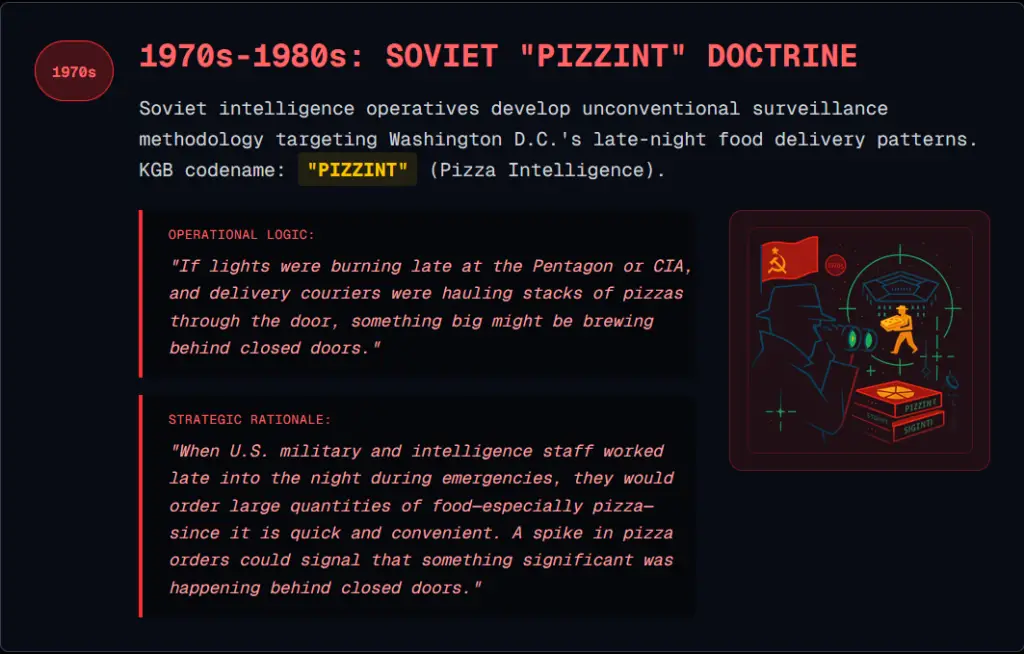
1970s-1980s: The Soviet “PIZZINT” (Pizza Intelligence) narrative: a low-tech Cold War observation story – searching for institutional overtime signals via delivery patterns.
In Cold War lore, Soviet intelligence is said to have monitored late-night food-delivery patterns in Washington, D.C. as a “low-cost early signal.” pizzint.watch packages this story as “KGB codename: PIZZINT,” arguing that if lights were on late at the Pentagon/CIA and stacks of pizza boxes were moving through the door, it could indicate elevated operational intensity inside. There is no official documentation presented for this; it largely circulates as online lore.
Washington Post also includes skeptical takes suggesting the historical verifiability of some of these Cold War stories may be limited.
(Washington Post)
1983-1989: Pattern validation phase

1983-1989: Pattern validation phase
In a TIME note dated August 13, 1990, some delivery workers at Domino’s locations around Washington claim they observed increases in delivery activity to the White House or Pentagon roughly 72 hours before “big news.” One courier quoted in the piece says Pentagon orders doubled the night before the Panama operation, and that a similar increase occurred before the Grenada invasion.
(TIME – “And Bomb The Anchovies”)
Still, this section should be read as witness-based observation rather than “hard proof.” TIME frames it explicitly as what delivery staff at various Domino’s locations said they were seeing.
August 1990 – January 1991: Gulf War documentation
AP/Los Angeles Times (1991): Late-night delivery figures shared by Frank Meeks – the narrative’s “data core.”
The most frequently cited quantitative core of the Pentagon Pizza narrative is based on an AP-bylined Los Angeles Times report published on January 16, 1991. The article says Frank Meeks, described as the owner of 43 Domino’s locations in the Washington area, reported record late-night deliveries: “21 pizzas” delivered to the CIA on the night of August 1, 1990; late-night Pentagon deliveries rising “from 3 to 101” starting January 7, 1991; and 55 pizzas delivered to the White House within a single time window.
(Los Angeles Times)
This is not merely rumor; it is a dated media record. However, it still relies on a single source account (the franchise owner’s reporting).
(Los Angeles Times)
CNN / Wolf Blitzer quote: “Monitor the pizzas”
A line often used to popularize the narrative is attributed to CNN’s then-Pentagon correspondent Wolf Blitzer: “Bottom line for journalists: Always monitor the pizzas.”
“Bottom line for journalists. Always monitor the pizzas.”
This quote is repeated in modern roundups and on dashboards like pizzint.watch as a humorous but instructive “OSINT reflex.”
2023-2024: Digital renaissance (virtual monitoring via Google Maps)
With Google Maps “Popular Times / live busyness” signals, the pizza index became remotely observable without physical surveillance. pizzint.watch describes itself as a real-time dashboard tracking popularity/busyness signals at Pentagon-area pizza places; the shift is essentially from “delivery receipts” to “platform telemetry.”
2023-2024 Digital renaissance: an OSINT workstation – map telemetry + anomaly tracking as “virtual pizzint.”
At this stage, what is measured is not “order volume” but venue busyness signals.
April 13, 2024: “Busier than usual” and the viral spike
On the pizzint.watch timeline, a note says that during Iran’s April 13, 2024 attack a Papa John’s location showed a “busier than usual” signal and that this went viral on X. The Guardian similarly reports that during Iran-Israel developments in 2024, the “unusual pizza busyness near the Pentagon” narrative regained traction.
On the night this article was written (January 5, 2026), around 22:00 Turkey time (TRT, UTC+3), the dashboard shows elevated busyness signals for two businesses located approximately 500 and 2500 meters from the Pentagon.
In the final version of this piece (January 5, 2026), around 22:00 TRT (UTC+3), the dashboard shows a busyness indicator of +400% at a nearby Domino’s Pizza and +145% at Extreme Pizza relative to other times. For the calculation method behind these percentages, see the relevant page.
June 12, 2025: @PentagonPizzaReport post and the simultaneity claim
(The Guardian)
June 2025 – Official response: “Nothing to offer”
Historical tracking methods: How pre-digital OSINT worked
Before dashboards, tracking typically ran through three channels:
- Franchise and store observations: Store owners and couriers could distinguish a “normal night” from an “unusual night” by operational volume.
- Journalistic verification: Reporters matched business-side volume anecdotes with crisis timelines and published them.
- Retroactive matching: After major events, stories about prior nights’ delivery patterns would recirculate. This can be compelling, but it amplifies confirmation bias risk.
Digital shift: How real-time monitoring works now
Today, the “pizza intelligence” narrative has moved from individual courier testimony toward a monitoring layer based on anonymized busyness signals. At the center are Google Maps busyness indicators and dashboards that poll those signals at intervals to detect anomalies.
One of the key sources used for this kind of monitoring, pizzint.watch, explicitly says it does not present these signals as official intelligence and stresses that “correlation is not causation.”
One example dashboard, pizzint.watch, positions itself as an educational and experimental monitoring project and states that its data should not be used for strategic decision-making. From a journalism standpoint, this matters: the tool’s limitations statement should also bound the editorial claims.
Data or coincidence?
Why this index is risky as a single indicator
- Confirmation bias: During big events, people look for the pizza signal; “false positive” nights fade from attention.
- Spurious correlation: Budget negotiations, critical cybersecurity updates, report deadlines, or major briefings can generate similar spikes.
- Operational adaptation: It is often argued that the Pentagon’s internal food options and security procedures can change external ordering behavior, increasing false-alarm risk.
A pizza signal is not “proof.” At most, it is a prompt to increase monitoring.
Case set: Days that produced “simultaneity”
The examples below are drawn from public narratives that link pizza signals with event timelines. The goal is not “predictive power” but to show how the signal gets packaged and where verification becomes necessary.
April 13, 2024: The night of Iran’s attack on Israel
Some posts claimed that Google Maps busyness charts for specific pizza locations around Washington, D.C. appeared unusually high and that this aligned with the timing of the attack.
June 2025: Israel-Iran tensions and the Pentagon-area busyness narrative
During June 2025 Israel-Iran tensions, some stories discussed cross-signals such as increased pizza busyness around the Pentagon and simultaneous drops at nearby social venues. On social media, some sources spoke of increases “as high as 300%.”
In open-source news flows, the June 2025 context was discussed both in relation to Israeli strikes and in relation to reporting about U.S. actions. When mapping dates to events, source specificity is critical.
January 3, 2026: U.S. action in Venezuela and the “early-lens” signal
Wire coverage from multiple outlets (Reuters/AP/CFR) reported that the U.S. conducted a major operation in Venezuela, that Nicolás Maduro was captured, and that the episode triggered international law and diplomacy debates.
At the same time, some social media accounts posted “above-normal busyness” signals for pizza locations around the Pentagon. This illustrates the most defensible use of the index: not as a “news-breaker,” but as a way to intensify monitoring when Washington’s overnight tempo may be abnormal.
Venezuela: Did the index actually reflect rising tension?
Framing the Venezuela case as a “prediction” creates editorial risk. A stronger frame is this: once wire services confirm an event, the pizza signal can be discussed only as a secondary indicator that may be consistent with increased internal tempo.
For that reason, the reporting language should avoid cause-and-effect claims and stay grounded in correlation and methodological limits. Also, because the index mostly measures physical busyness signals, it leaves open a major gap: it says little about actual order counts.
How to read the index
The Pentagon Pizza Index is a striking example of how OSINT can interpret “involuntary signals” emitted by an institutional metabolism.
Its value is not as a standalone prediction tool, but as a case study in classifying public data correctly, cross-checking signals, and managing uncertainty.
From a HepsiVeri methodology standpoint, the right use is an “early lens”: when a signal appears, you increase monitoring, but you do not build event claims without wire confirmation and a multi-source chain. That preserves narrative curiosity without eroding editorial credibility.
Sources
- Los Angeles Times (January 16, 1991) – delivery-volume narrative for the Pentagon and CIA:
https://www.latimes.com/archives/la-xpm-1991-01-16-mn-374-story.html - The Washington Post (December 18, 1998) – “pizza index” and political overtime example:
https://www.washingtonpost.com/archive/politics/1998/12/18/on-the-pizza-index-washington-is-in-a-frenzy/ed2ecbd9-67ff-419c-bb23-4ab2a938239c/ - TIME (August 13, 1990) – “And Bomb The Anchovies”:
https://time.com/archive/6715614/and-bomb-the-anchovies/ - pizzint.watch – project description and methodology framing:
https://pizzint.watch/about/ –
https://pizzint.watch/terms/ - Washingtonian (June 26, 2025) – 2025 June examples and renewed attention:
https://www.washingtonian.com/2025/06/26/the-pentagon-pizza-report-is-the-newest-indicator-of-geopolitical-crisis/ - The Guardian (June 13, 2025) – pizza-busyness narrative and cross-signals:
https://www.theguardian.com/world/2025/jun/13/pentagon-pizza-delivery-israel-iran-attack - Reuters (January 3, 2026 and onward) – Venezuela operation and legal/diplomatic debate.
- AP (January 3, 2026 and onward) – governance and judicial process developments in Venezuela.
- Council on Foreign Relations (CFR) – background analysis on Venezuela.